The UK Centre for Greening Finance & Investment (CGFI) is a national centre established to accelerate the adoption and use of climate and environmental data and analytics by financial institutions.
The IEA is part of CGFI and leads on ensuring the outputs from CGFI have a real impact on these institutions through the development of software tools and data visualisations to help explore weather and climate impacts.
The Wind and Flood Correlation Explorer is an example of the work we are co-developing with researchers and financial services companies.
Process
Wind and Flood Correlation Explorer
Financial institutions need to take into account property risk for insurance, reinsurance, mortgages, and credit risk. Properties are at risk from wind and flood hazards, and there is evidence to suggest that these covary; storms can bring wind and flooding simultaneously, amplifying risk. Wind and flood hazards are currently analysed separately by insurers and catastrophe modellers. This could put capital at risk of correlated windstorm and flood events.
CGFI researchers have investigated the correlations between extremes relating to wind and flooding at all timescales from daily to seasonal for Europe. The results are detailed in Hannah et al (2023) and this visualisation tool showcased these results as an extension to the paper.
Solution
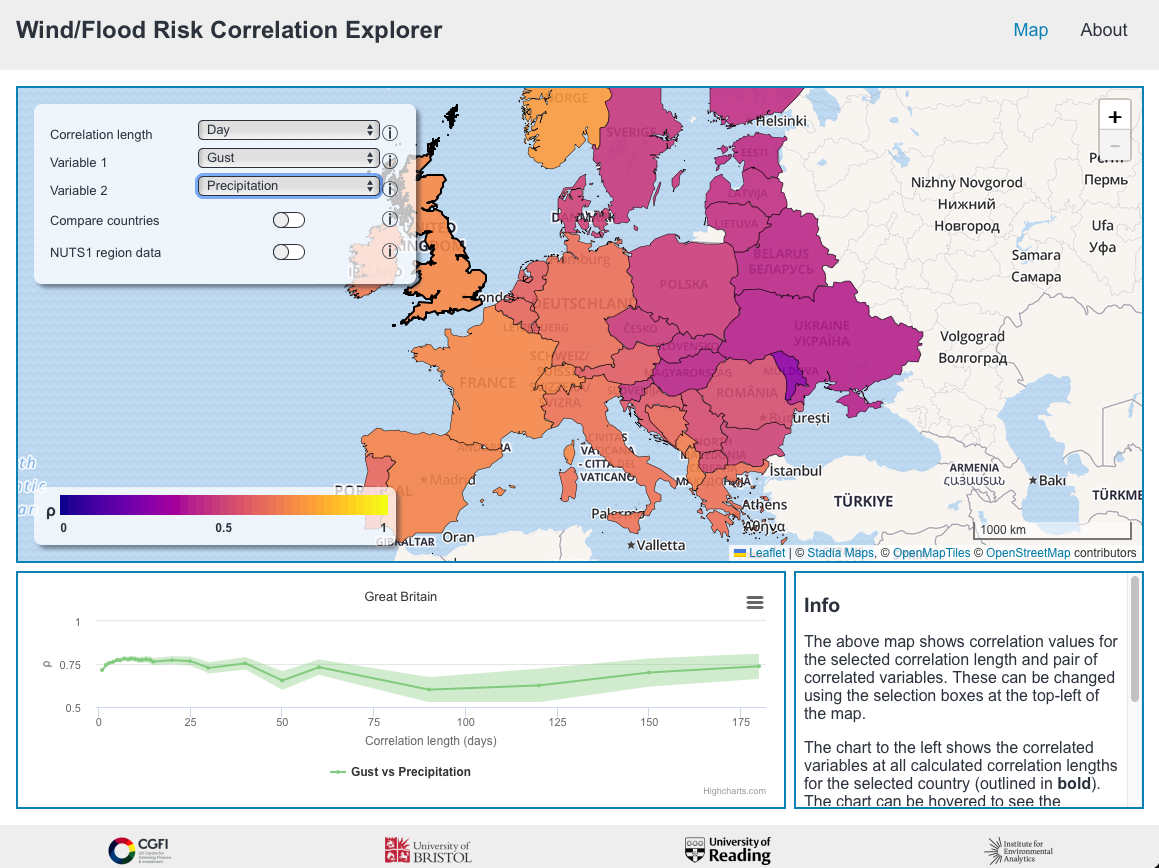
The tool enables users to explore the correlations between historical hydro-meteorological variables (wind gust, river flow and precipitation) and correlations between metrics to estimate impacts (Storm Severity Index and Flood Severity Index). The user can visualise these correlations on a map for selected timescales (day, week, month and season). There is also a way to display correlations across all timescales for each country in graphical form.
https://the-iea.github.io/cgfi-wind-flood/
It also includes a new a new Flood Severity Index (FSI), which can be used to help insurers understand compounding risks and hghlights multiple correlations between wind and flood hazards in Europe across multiple timescales.
Impact
“I think it’s a really good tool for the industry to quickly visualise the correlation between wind and flood over Europe. The ability to change the correlation length is extremely useful in the current market, and how that correlation varies between the different countries.” Adrian Champion, Aon

Tell us about your data challenge